
- Zoom In for combined exposure to each stock across your ETF portfolio
- Zoom Out for details on which ETFs contribute to a particular stock exposure
It is axiomatic that investors should know what they own, and the fact that ETFs facilitate this by making their holdings transparent is one of their key advantages over traditional actively managed mutual funds. While mutual funds disclose their holdings quarterly, these reports are often stale by the time they are published and become more so as time progresses. In contrast, ETFs report their complete holdings daily (except for a tiny new corner of the market known as “Ants,” or active non-transparent ETFs), allowing investors to see exactly what they own in near real-time.
Keeping track of what stocks you own becomes more cumbersome as the number of ETFs in a portfolio grows
However, as investors combine multiple ETFs into a portfolio keeping track of what they own becomes a more cumbersome task often involving thousands of securities. To do so manually an investor would have to go to each ETF issuer’s website, download a spreadsheet containing the fund’s constituents, apply the ETF’s portfolio weight to the constituent weights (i.e., if SPY were 50% of your portfolio and SPY’s weighting of AAPL is 6.4%, then AAPL’s weight in your portfolio is 3.2%), and then combine this spreadsheet with one for every other ETF in your portfolio.
Combining all those spreadsheets can be quite laborious since each ETF issuer has different file formats and often uses different stock identifiers—particularly when foreign shares are included—rendering lookup and matching functions useless.
Thankfully, none of that manual labor is necessary. The ‘ZoomLens’ tab in the Portfolio Builder tool on ETF Research Center does all that in a matter of seconds. And it makes it easy to see which ETFs are contributing to a stock’s portfolio weight when concentration becomes a concern.
To illustrate, we created a simple global equity portfolio using seven different ETFs (we also used the Vanguard Total World Stock Market ETF, VTI, as a benchmark). After clicking on the “Analyze” button we are presented with six tabs, the third one of which is for the ZoomLens. Click on the tab to “Zoom In” to the combined stock exposures from across your ETF portfolio.
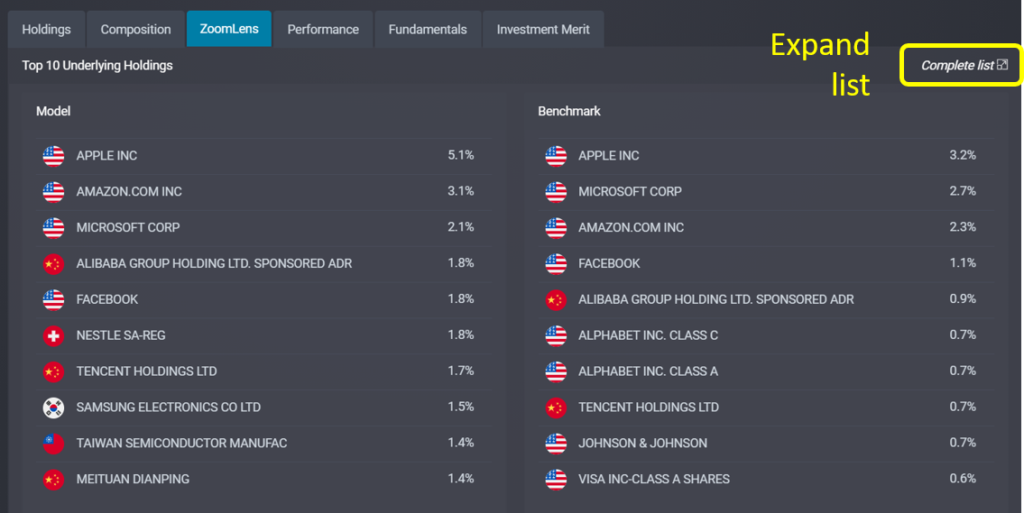
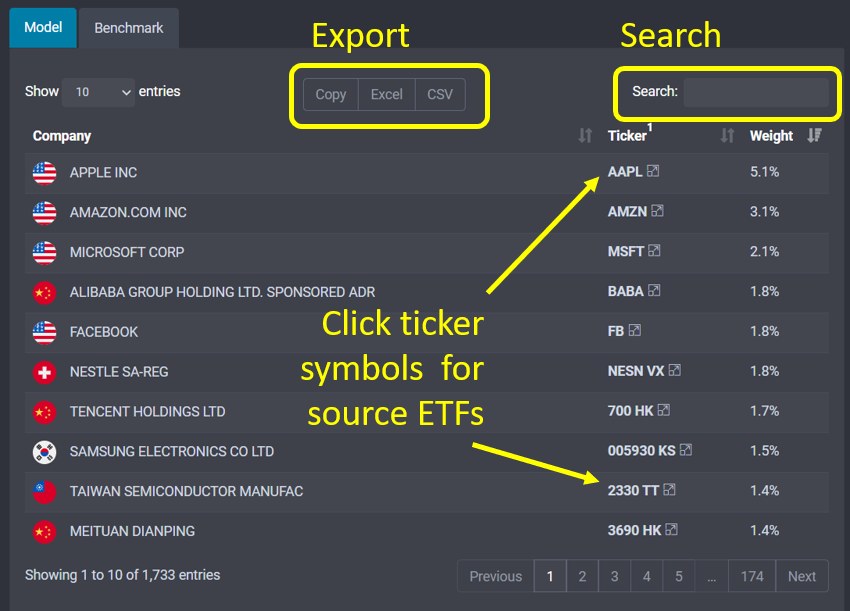
Initially just the Top 10 Underlying Holdings are shown, from both the ‘Model’ and ‘Benchmark’ sides of your portfolio. However, just click on link to the ‘Complete list’ in the upper right-hand corner to launch a new window with your ETF portfolio’s entire list of stock holdings, which may run into thousands of securities. It may take a few seconds for the page to load if the list is long. Once loaded, the table is searchable, sortable, and exportable.
Now you can see exactly what stocks you own across all the ETFs in your portfolio, and your combined exposure to each. But the utility of Portfolio Builder’s ZoomLens goes beyond that.
Suppose you find some of the larger concentrations to be problematic and decide they should be reduced. To determine which ETFs are contributing to the problematic exposure simply click on the company’s ticker symbol to “Zoom Out” to view ETFs relevant to this particular stock.
In our model portfolio above the overall exposure to Apple is 5.1%, which is considerably higher than the 3.2% exposure found in our benchmark VTI. By clicking on Apple’s ticker symbol, AAPL, we get the following pop-up screen showing us that three of the ETFs in our portfolio hold shares of AAPL, and how the stock’s weight in each ETF multiplied by the weighting of those ETFs in our portfolio combines to result in the 5.1% exposure overall. (A fourth column adjusts exposure to reflect its size in just the equity portion of a portfolio, which is helpful when fixed income ETFs are included. But our sample portfolio is 100% equities so in this case the numbers are the same.)
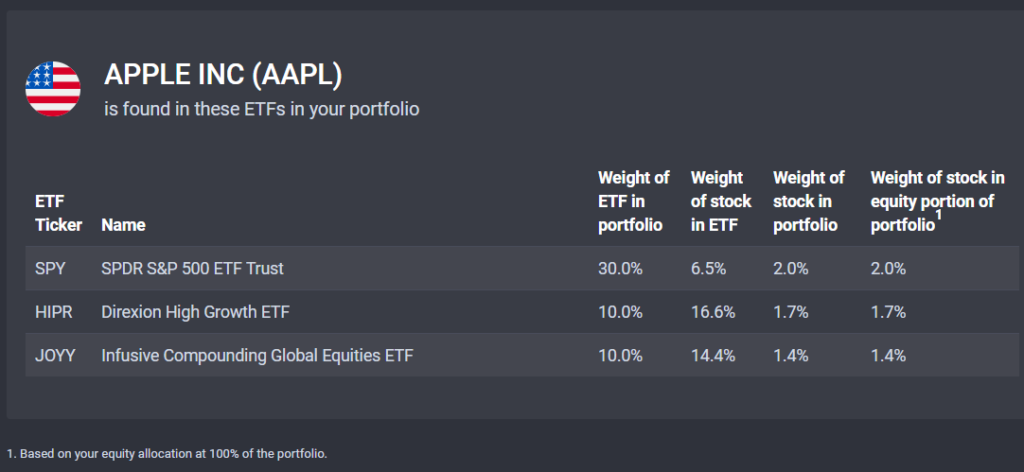
Two of the ETFs—the Direxion High Growth ETF (HIPR) and the Infusive Compounding Global Equities ETF (JOYY)—both have double-digit exposure to shares of Apple, so their contributions are sizable despite the funds’ relatively small weighting in our ETF portfolio. We may want to consider substituting another ETF for either of these, or further reduce our 10% weighting, to diminish Apple’s concentration in the overall portfolio.
Knowing what you own is one of the cardinal rules of investing, but that can be cumbersome even for transparent vehicles like ETFs when combined into a portfolio. The ZoomLens tab on ETF Research Center’s Portfolio Builder tool does the tabulating work for you, shows you where exposure to each stock is coming from, and allows you to quickly see the potential impact from any changes you make.
The Portfolio Builder tool is included with Individual and Professional memberships to ETF Research Center. Sign up here to try it for FREE for 30 days.